Accessible Animated Timeline Component
- Role: Lead Developer
- At: Apti
- Date: Jan 2026
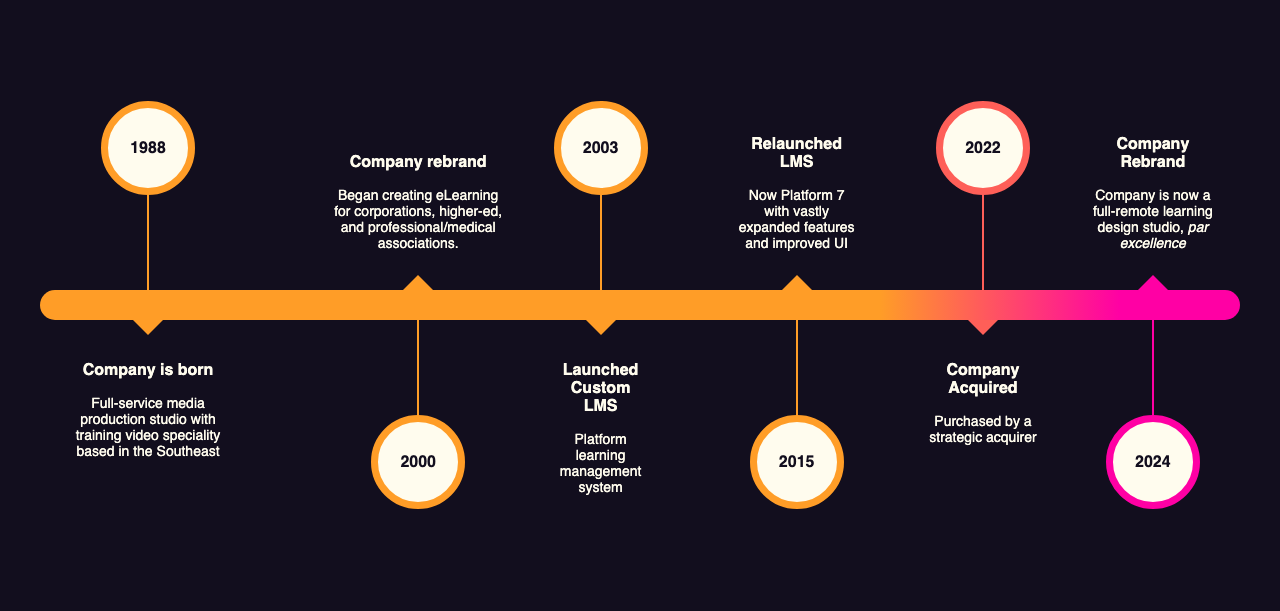
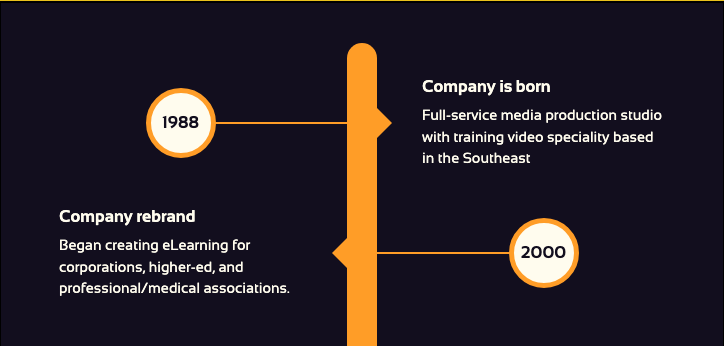
The brief was simple: add a designer’s timeline graphic — six milestones strung along a gradient rail — to a company’s About page. A single image that dense isn’t accessible: none of its text is selectable, searchable, or readable by a screen reader, and on a phone it would just shrink until it stopped being legible. Since the copy had to be re-typed either way, I built it as real HTML instead — which, almost for free, also made an entrance animation and a proper mobile layout possible.
The milestones and copy shown below are anonymized placeholders; the component itself is the real, unmodified code.
- 3 layouts generated from one component, not one flattened image
- 2.6s → 0.9s largest contentful paint: a naive full-resolution image drop-in vs the live component (Lighthouse, same page)
- 181KB → 2.5KB payload for the same graphic: a retina-quality export vs the component's CSS + JS + markup, gzipped
The brief
A designer had put together a timeline graphic tracing the company’s history — six milestones, each a date, a heading and a line of body copy, strung along a gradient rail. “Add this to the page” was the whole brief.
From pixels to a semantic list
The graphic on its own is a paragraph’s worth of dates, headings and body copy flattened into pixels: none of it selectable, searchable, or readable by a screen reader, and on a phone it would simply shrink until it stopped being legible. Since the only real fix was re-typing the copy anyway, that happened first and alone, before any visual styling — a plain <ul> of milestones, each a heading with its date and a line of body text. No layout decisions yet, just structure a browser, a screen reader and a search engine could all parse correctly.
That decision up front did double duty: it’s what made the page accessible, and it’s what made everything that follows possible. Once each milestone is its own element in the DOM, CSS and JavaScript can address it individually in ways a single image never allows.
Rebuilding the design in CSS
With the structure in place, the original graphic became a spec to rebuild rather than an image to embed. CSS Grid lays each milestone into date / connector / content areas; pseudo-elements draw the little arrows pointing from each date to its text, and the circular date marker itself. A single modifier class flips alternating entries to the other side of the rail, reproducing the graphic’s zig-zag layout with no extra markup.
The color progression carried over too: a CSS custom property defaults to orange and gets overridden to red, then pink, on the later entries — so the markers and connectors shift color down the line exactly as they did in the original gradient rail, driven by two class names instead of hand-picked pixel colors.
An animation falls out of it
This is where having real elements instead of flat pixels started paying off in a way that wasn’t part of the brief. Because each milestone was now its own list item, it could be targeted and transitioned independently — something no raster image could ever do. A small script reveals the milestones one at a time as the page loads, each one un-collapsing a beat after the last. The effect reads as the timeline drawing itself in — a detail that fell out of the markup decision almost for free, not something storyboarded up front.
See it for yourself
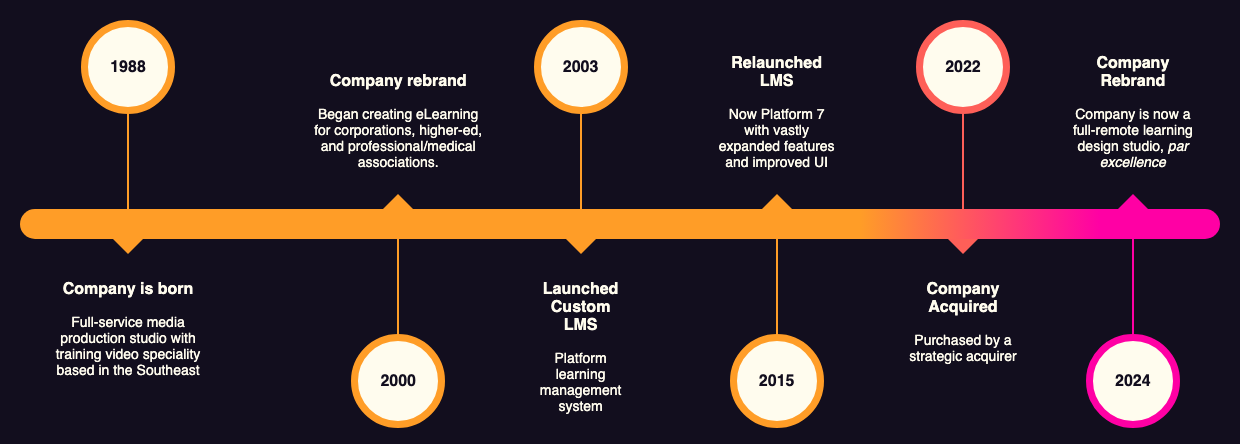
Same design, same six milestones — but only one side of this is real. Toggle between the original flattened graphic and the actual component below, live and interactive, not a screenshot of it.
Resize the window to see the layout reflow instead of just shrinking; reload with “reduce motion” on and it renders fully visible with no animation.
-
1988 Company is born
Full-service media production studio with training video speciality based in the Southeast
-
2000 Company rebrand
Began creating eLearning for corporations, higher-ed, and professional/medical associations.
-
2003 Launched Custom LMS
Platform learning management system
-
2015 Relaunched LMS
Now Platform 7 with vastly expanded features and improved UI
-
2022 Company Acquired
Purchased by a strategic acquirer
-
2024 Company Rebrand
Company is now a full-remote learning design studio, par excellence
What the image couldn’t do
The original graphic’s biggest weakness only shows up on a phone: a wide horizontal timeline, scaled to fit a narrow screen, stops being readable long before it stops being visible. An image has exactly one layout; shrink it and the text goes with it.
Real markup doesn’t have that limit. Two breakpoints change the timeline’s structure, not just its size: on the smallest screens it’s a plain stacked list; in the middle range (shown above) it’s a stacked list with the date centered in a circle; only at wide, desktop widths does it become the full left-to-right rail. The content stays legible at every size because the layout actually changes to fit it.
Why it ended up a block
The site this lives on is built on the WordPress block editor, so a chunk of static content wrapped around a page template doesn’t belong the way a real block does — this became a custom Gutenberg block with its own styles and script, insertable like any other.
That also solved a problem that had nothing to do with WordPress: extensibility. The original graphic lived in a design file somewhere, and adding a seventh milestone down the road would have meant tracking that file down and re-exporting a new image. As HTML, the timeline just takes another list item.
Looking back
The animation and the responsive layout were never part of the brief — they fell out of choosing semantic HTML over an image for accessibility reasons, almost incidentally. That’s usually how it goes: the accessible option isn’t a compromise on the result, it’s often a better one.
Stack & skills
- CSS Grid
- CSS Custom Properties
- JavaScript
- Sass
- WordPress
- Gutenberg
- Accessibility
- Responsive Web Design